| Area | Basin-wide |
| Topic | Aquatic Inverts: Richness Index, All Samples |
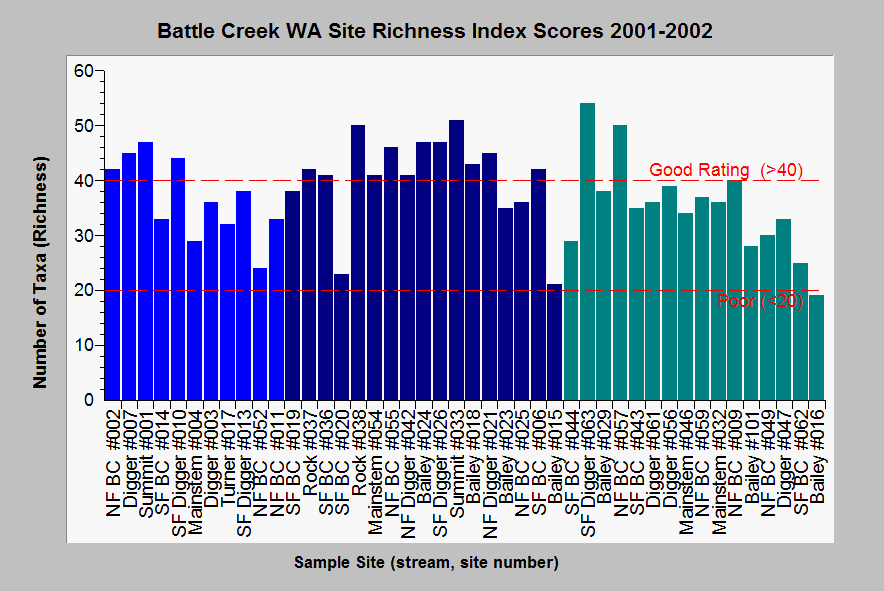
| Caption: This chart shows the number of total aquatic macroinvertebrate species or taxa (Richness Index) from Battle Creek Watershed Assessment sites as measured in fall 2001 (light blue), spring 2002 (dark blue) and fall 2002 (teal). The reference on the chart of more than 40 taxa indicating good habitat and fewer than 20 as poor comes from Hafele and Mulvey (1998) as cited by Ward and Kvam (2003). Bailey Creek again has the lowest scores, similar to B-IBI (see previous Topic). Data from Ward and Kvam (2003). See Info Links for more information. | |
 |
To learn more about this topic click Info Links .
To view additional information (data source, aquisition date etc.) about this page, click Metadata .
To view the table with the chart's data, click Chart Table web page.
To download the table with the chart's data, click aq_inverts_01_02.dbf (size 8,738 bytes)
To download the table with the chart's data as an Excel spreadsheet, click aq_inverts_01_02.dbf.xls (size 19,714 bytes) .
| www.krisweb.com |
