| Area | General |
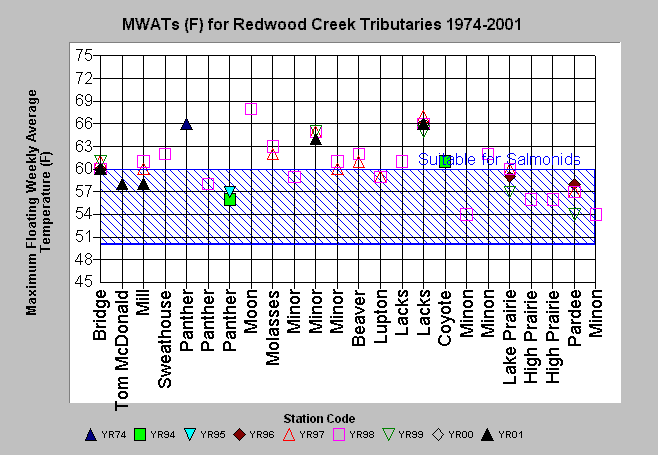
| Topic | Temperature: MWATs at All Redwood Creek Tributary Sites (1994-2001) |
| Caption: Maximum floating weekly average temperature (MWAT) values for all years of data are plotted here for comparison to the "fully suitable MWAT range for salmonids" according to NCWAP/EMDS criteria. Lower Redwood Creek tributaries are at left, Middle tributaries in the center, and Upper tributaries at right. Most Middle Redwood Creek tributaries sites were found unsuitable for rearing salmonids most years measured and at all sites. See Info Links for more information. | |
 |
To learn more about this topic click Info Links .
To view a table of information about this data click Metadata .
To view the table with the chart's data, click Chart Table web page.
To download the table with the chart's data, click mwat_tribs.dbf (size 4,339 bytes) .
To view the table with the chart's source data, click Source Table web page.
To download the table with the chart's source data, click all_mwats.dbf (size 5,350 bytes)
| www.krisweb.com |
