| Area | Scott River |
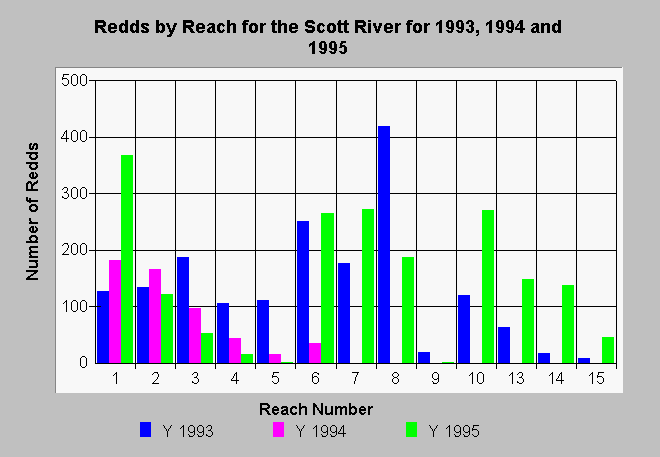
| Topic | Fish: Fall Chinook Redds by Reach 1993-1995 |
| Caption: This graph shows the distribution of fall Chinook salmon redds on the Scott River during three different years. Flows were very low in the 1994 spawning season and the fish were concentrated in the lowest reaches of the river. The difference in distribution between 1993 and 1995 is harder to explain, and fall Chinook redd distribution varies substantially in wetter years when fish have access to upper reaches. Little access was allowed to reaches 11 and 12 by land owners, so these were eliminated from comparison. However, few redds were noted in these reaches according to aerial reconnaissance. Data provided by the California Department of Fish and Game. See Info Links for more information. | |
 |
To learn more about this topic click Info Links .
To view additional information (data source, aquisition date etc.) about this page, click Metadata .
To view the table with the chart's data, click Chart Table web page.
To download the table with the chart's data, click fish_redds_sc_byreach_1993_2002.dbf (size 1,686 bytes) .
| www.krisweb.com |
