| Area | Scott River |
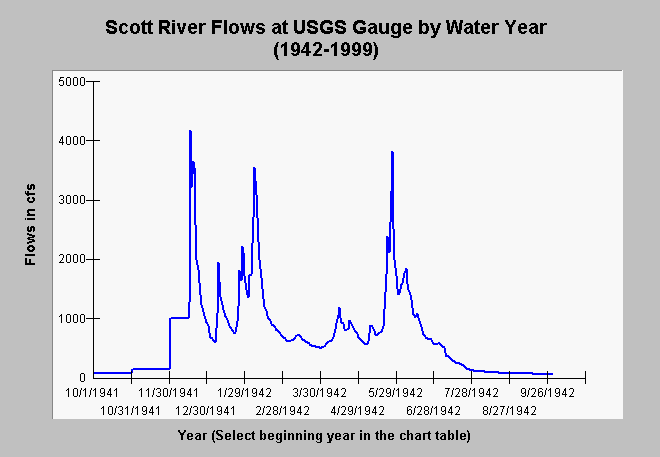
| Topic | Flow: Scott at Jones Beach 1942-1999 |
| Caption: This chart displays the hydrograph by water year for the main stem of the Scott River at Jones Beach below Fort Jones as taken from USGS stream gauge flow measurements. The graph shows average daily flows by water year in cubic feet per second (cfs). The water year first shown above is for 1942. Use the slide bar at right to view other years. The Y-axis of the graph may vary depending on the magnitude of the flows in any given year. Aggradation at the Scott River flow gauge since 1997 may be giving an over-estimate of base flows during summer. | |
 |
To learn more about this topic click Info Links .
To view additional information (data source, aquisition date etc.) about this page, click Metadata .
To view the table with the chart's data, click Chart Table web page.
To download the table with the chart's data, click scflo_99.dbf (size 374,822 bytes) .
| www.krisweb.com |
