| Area | North Fork Battle |
| Topic | Climate: Rainfall - Volta Power House - Average Monthly 1920-2000 |
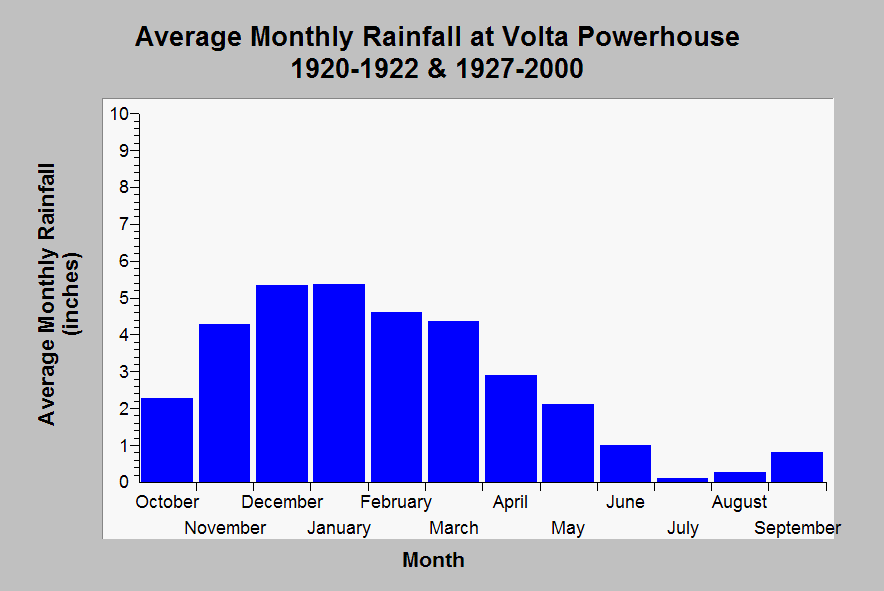
| Caption: This chart shows average monthly rainfall accumulation at the Volta Power House rain gauge (DWR # A40 9390 00) based on records from water years 1920-1922 and 1927-2000. Battle Creek rainfall is seasonally variable with most of the rainfall occurring in the winter months. Rainfall amounts are less than those collected at the Manzanita Lake gauge because it is higher in elevation and receives more precipitation because of the orographic effect. Data are compiled by the California Department of Water Resources. See Info Links for more information. | |
 |
To learn more about this topic click Info Links .
To view additional information (data source, aquisition date etc.) about this page, click Metadata .
To view the table with the chart's data, click Chart Table web page.
To download the table with the chart's data, click climate_rainfall_monthly_ave_volta.dbf (size 338 bytes)
To download the table with the chart's data as an Excel spreadsheet, click climate_rainfall_monthly_ave_volta.dbf.xls (size 4,096 bytes) .
| www.krisweb.com |
