| Area | South Fork Ten Mile |
| Topic | Aquatic Insects: Richness Index for All SF Ten Mile River HTC Sites |
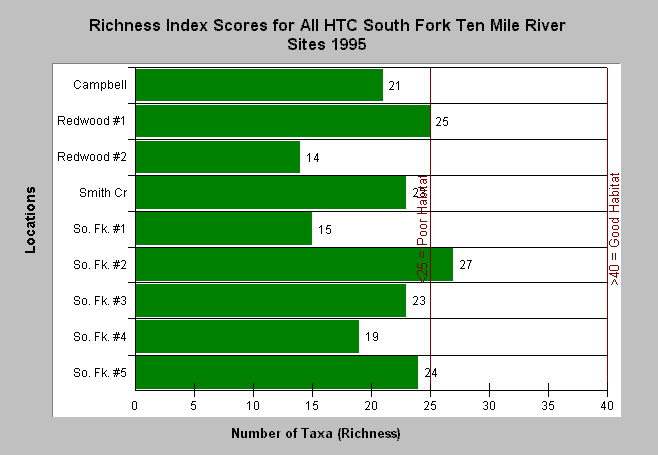
| Caption: The Chart above shows the total number of aquatic insect species, also known as Richness, at all sites in the South Fork Ten Mile River basin in 1995. Samples conducted by Georgia Pacific Corp and provided to KRIS by the Hawthorne Timber Company. Samples were collected throughout June of 1995. Contemporaneous samples are optimal because some species may emerge as adults as the season progresses; therefore, scores may not show maximum scores for the location because emergence of insects prior to sampling. RAPID Bioassessment samples are supposed to contain at least 300 specimens but some samples had fewer (see Source Table). Thresholds shown are those described by John Lee, aquatic entomologist. See Info Links for more information and links to bibliographic references. | |
 |
To learn more about this topic click here .
To view the table with the chart's data, click Chart Table web page.
To download the table with the chart's data, click sftenbugs.dbf (size 1,450 bytes) .
To see meta information about the data table used for this topic click here
To view the table with the chart's source data, click Source Table web page.
To download the table with the chart's source data, click gpbugsource.dbf (size 3,189 bytes)
| www.krisweb.com |
