| Area | North Fork Ten Mile |
| Topic | Temperature: FWA, North Fork Sites, 1997 |
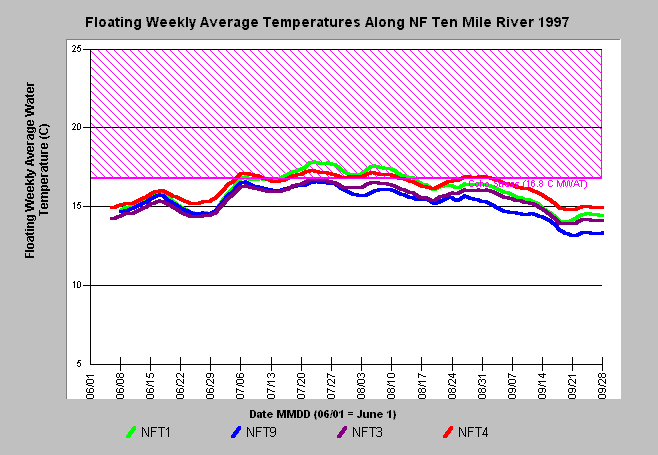
| Caption: The above chart plots floating weekly average temperatures in 1997 for four sites located on the North Fork Ten Mile River. The legend lists sites in sequence from upstream to downstream, showing that the stream cools flowing from site NFT1 to site NFT9, and then warms by 0-0.5 degrees Celsius before reaching the Little North Fork at Site NFT3, and by another 0.5-1.0 degrees before reaching the South Fork. The 16.8 degree C reference value is from Welsh et al. (2001). See Info Links for more information. Data provided by the Hawthorne Timber Company. Click on Picture for a map of locations and photo of monitoring site. | |
 |
To learn more about this topic click here .
To view the table with the chart's data, click Chart Table web page.
To download the table with the chart's data, click ch_cfnf_avg_float.db (size 671,744 bytes) .
To see meta information about the data table used for this topic click here
To view the table with the chart's source data, click Source Table web page.
To download the table with the chart's source data, click ch__alltemp_sum.db (size 1,536,000 bytes)
| www.krisweb.com |
