| Area | Basinwide/General |
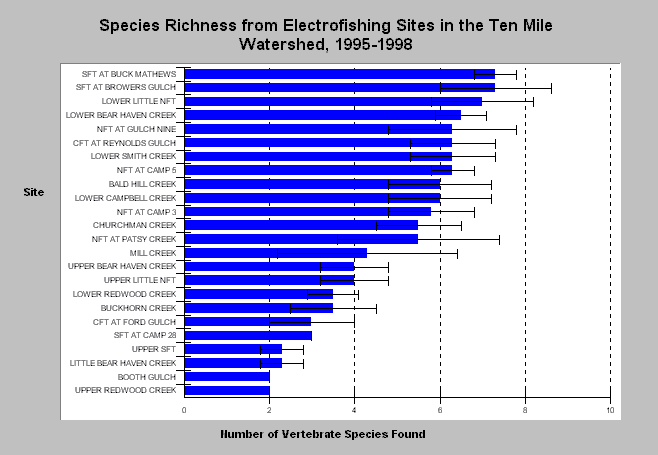
| Topic | Fish: Vertebrate Species Richness, Ranked by Stream, 1995-1998 |
| Caption: The total number of species captured during electrofishing varied from 2 to 9. The above chart ranks average species richness per site for the years 1995-1998. See adjacent topic for the same data organized by sub-basin. See Chart Table for actual data, or Click on Picture for a map of locations. Click on Info Links for more information. | |
 |
To learn more about this topic click here .
To view the table with the chart's data, click Chart Table web page.
To download the table with the chart's data, click vert_rich.dbf (size 2,642 bytes) .
To see meta information about the data table used for this topic click here
| www.krisweb.com |
