| Area | Coyote Valley |
| Topic | Flow: Potter Valley Powerhouse - Monthly Ave 1975-2001 |
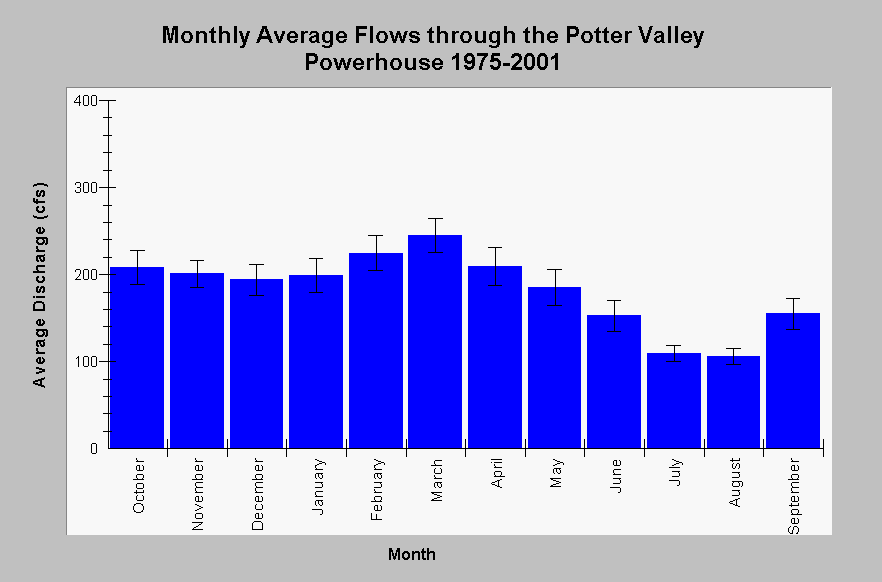
| Caption: This chart displays monthly average discharge (cfs) through the Potter Valley Powerhouse near Potter Valley, CA (US Geological Survey gage station #11471099) for the water years 1975 through 1983 and 1987 through 2001. Monthly average flows through the powerhouse range from 100 to 250 cfs year round. The Potter Valley Project was developed in 1908. All water funneled through the Potter Valley Powerhouse is directly diverted from the Eel River above the Cape Horn Dam. Monthly flows are compiled by the US Geological Survey. See InfoLinks for more information. | |
 |
To learn more about this topic click Info Links .
To view additional information (data source, aquisition date etc.) about this page, click Metadata .
To view the table with the chart's data, click Chart Table web page.
To download the table with the chart's data, click flow_monavg_usgs11471099_pvpowerhouse_1975_2001.db (size 4,096 bytes) .
To view the table with the chart's source data, click Source Table web page.
To download the table with the chart's source data, click flow_mon_usgs11471099_pvpowerhouse_1975_2001.dbf (size 12,890 bytes)
| www.krisweb.com |
