| Area | Basin-wide/Regional |
| Topic | WQ: 2002 Turbidity First Flush Results |
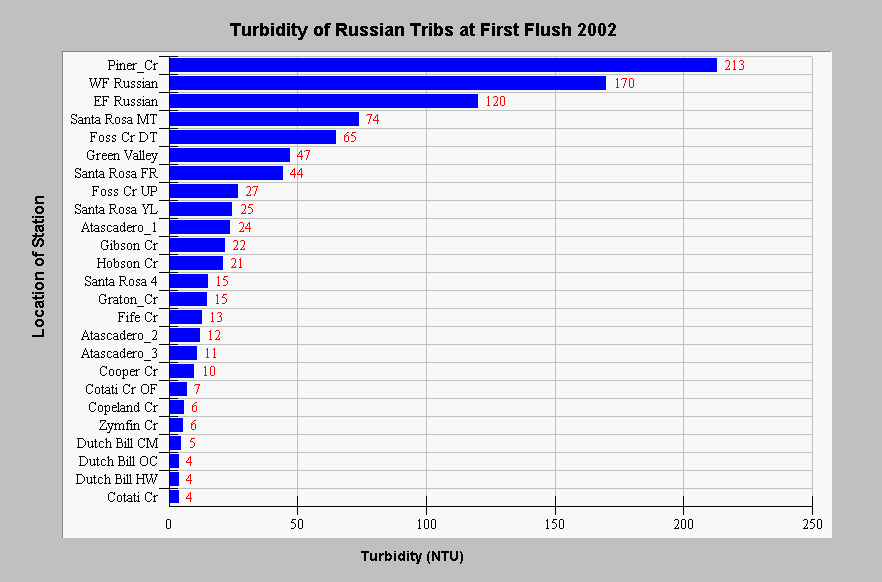
| Caption: The results above show the range of values for turbidity in nephelometric turbidity units (NTU) taken as part of the First Flush Russian River monitoring effort in 2002. The data represent only the first of three samples taken at each site. While samples were collected by volunteers, wet chemistry with a calibration curve and a spectrophotometer were carried out by staff of the North Coast Regional Water Quality Control Board at their lab in Santa Rosa. While values for Piner Creek, the West Fork Russian and the East Fork Russian all ranked relatively high, turbidity is sensitive to the timing of upstream sediment delivery and these data can not be used to assess chronic impacts of turbidity to aquatic biota. For more information on methods and a link to protocols and reports, see InfoLinks. | |
 |
To learn more about this topic click Info Links .
To view additional information (data source, aquisition date etc.) about this page, click Metadata .
To view the table with the chart's data, click Chart Table web page.
To download the table with the chart's data, click turb_ff_chart_2002.dbf (size 1,105 bytes) .
| www.krisweb.com |
