| Area | Basin-wide/Regional |
| Topic | WQ: 2002 Conductivity Sampling by CCWI |
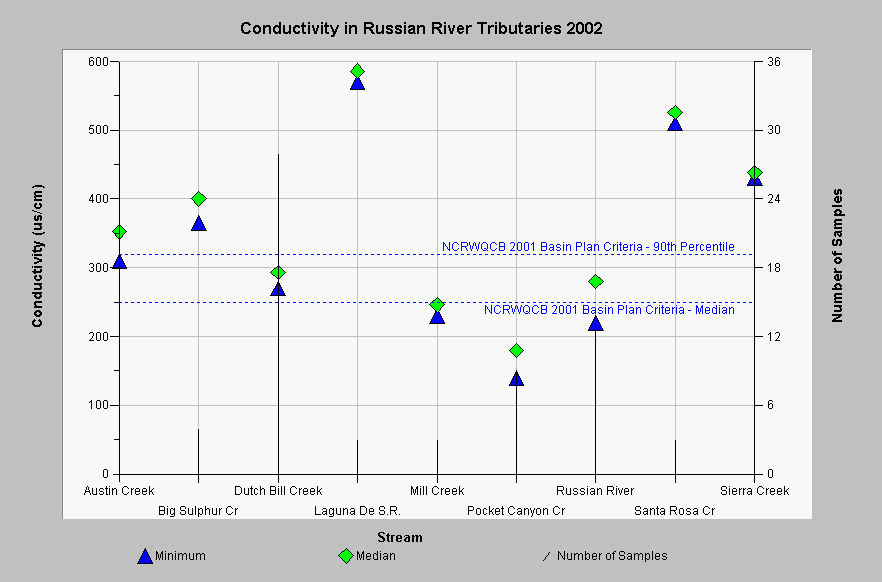
| Caption: This chart shows results of conductivity sampling in Russian River tributaries by the Community Clean Water Institute. Minimum and median values for each location are plotted. The number of samples is plotted on the second y-axis. See InfoLinks for more information. | |
 |
To learn more about this topic click Info Links .
To view additional information (data source, aquisition date etc.) about this page, click Metadata .
To view the table with the chart's data, click Chart Table web page.
To download the table with the chart's data, click wq_ccwi_russian_02.db (size 16,384 bytes) .
To view the table with the chart's source data, click Source Table web page.
To download the table with the chart's source data, click wq_ccwi_source_2002.db (size 57,344 bytes)
| www.krisweb.com |
