| Area | Basin-wide/Regional |
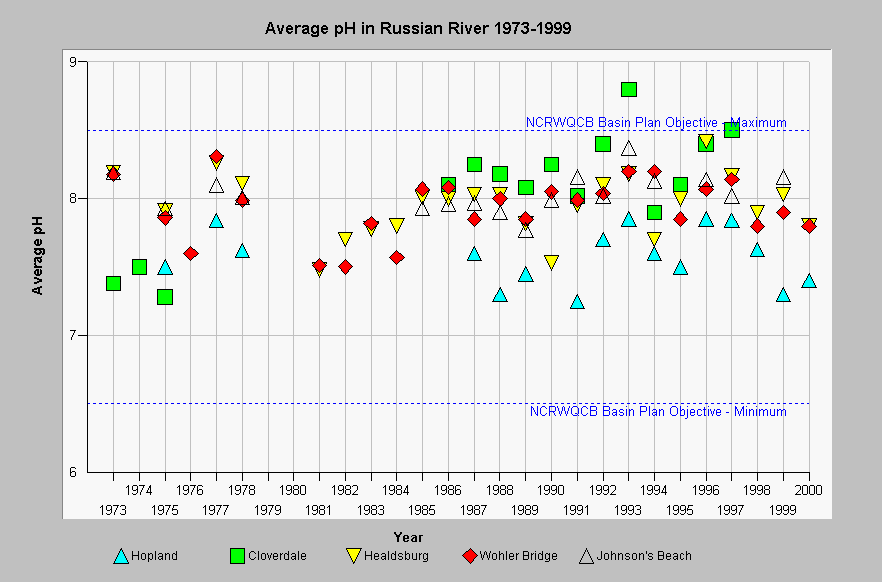
| Topic | WQ: 1973-2000 pH at Five Russian River Sites |
| Caption: This chart shows average pH for all measurements at five mainstem Russian River sites for the period 1973-2000. Note that the average pH measured at Cloverdale exceeds the Basin Plan objective for maximum pH. Average pH at Wohler Bridge increased through the 1980s but appears to have decreased since 1997. Plotted values are the average of all measurements taken in the calendar year. Number of samples per year varied from 1 to 56. Earlier years had more sampling intensity, in general. Data were provided by the North Coast Regional Water Quality Control Board (NCRWQCB). See InfoLinks for more information. | |
 |
To learn more about this topic click Info Links .
To view additional information (data source, aquisition date etc.) about this page, click Metadata .
To view the table with the chart's data, click Chart Table web page.
To download the table with the chart's data, click rr_waterquality_jd_ph.db (size 18,432 bytes) .
To view the table with the chart's source data, click Source Table web page.
To download the table with the chart's source data, click rr_waterquality_jd.dbf (size 3,141,378 bytes)
| www.krisweb.com |
