| Area | General |
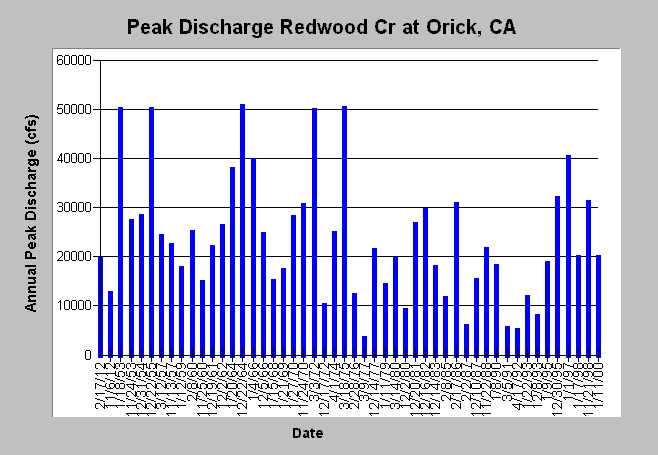
| Topic | Flow: Annual Peak Discharge, Redwood Cr @ Orick |
| Caption: The figure above shows annual peak discharge from the USGS gage 11482500, Redwood Cr @ Orick, CA. The maximum and minimum peak discharges of record occurred 12/22/64 (50,500 cfs) and 3/9/77 (3,010 cfs), respectively. Peak discharge records are taken from USGS data. Note that the peak flow record contains gaps for consecutive water years. See Info Links for more information. | |
 |
To learn more about this topic click Info Links .
To view a table of information about this data click Metadata .
To view the table with the chart's data, click Chart Table web page.
To download the table with the chart's data, click discharge_redwoodatorick_peak.dbf (size 1,148 bytes) .
| www.krisweb.com |
