| Area | South Fork |
| Topic | Temperature: Coho Stress in SF Noyo lowermost 1996 |
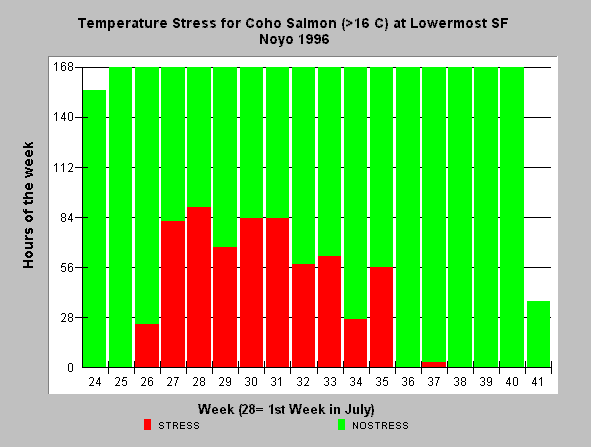
| Caption: The bar graph above shows the number of hours in the week during the summer of 1996 South Fork Noyo water temperatures (lowermost site 16) exceeded stressful levels for coho salmon, which is designated as 16 degrees Celsius in the KRIS Noyo project (see InfoLinks). The x-axis represents number of weeks (where 28 represents the first week in July etc). | |
 |
To learn more about this topic click here .
To view the table with the chart's data, click Chart Table web page.
To download the table with the chart's data, click sfn1696strss.dbf (size 1,228 bytes) .
To see meta information about the data table used for this topic click here
To view the table with the chart's source data, click Source Table web page.
To download the table with the chart's source data, click sfnoyostrm_temps.dbf (size 3,997,861 bytes)
| www.krisweb.com |
