| Area | Mainstem |
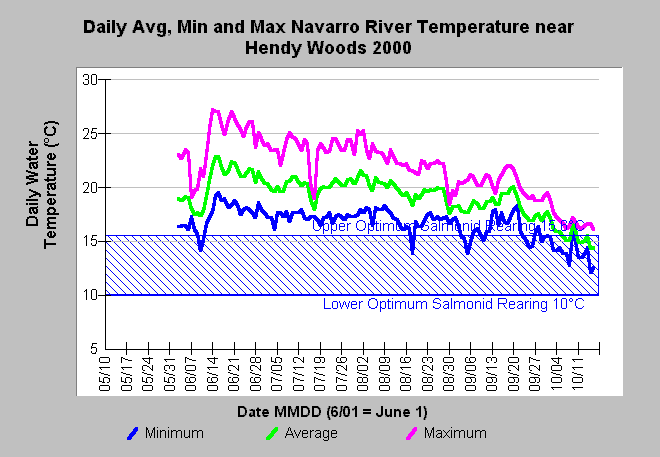
| Topic | Temperature: MMA at Navarro R near Hendy (Site 88-1) 2000 |
| Caption: The chart shows the daily minimum, maximum and average water temperature in Celsius (°C) of the Navarro River at Hendy Woods (Site 88-1) for the year 2000. Daily maximum and average temperatures were above 15.6°C, the upper optimal temperature for salmonid rearing (McCullough, 1999), during every day between May and August, but minimum temperatures fell back into that range in June and after mid-August on some nights. Maximum temperatures also exceeded the recognized lethal level for Pacific salmon of 25 C (Sullivan et al., 2000). See Info Links for more information. Data comes from automated water temperature data probes placed by the Mendocino Redwood Company. | |
 |
To learn more about this topic click Info Links .
To view additional information (data source, aquisition date etc.) about this page, click Metadata .
To view the table with the chart's data, click Chart Table web page.
To download the table with the chart's data, click temp_nav_mrc_dailymma.db (size 270,336 bytes) .
To view the table with the chart's source data, click Source Table web page.
To download the table with the chart's source data, click navarro_temps.dbf (size 9,243,343 bytes)
| www.krisweb.com |
