| Area | Mainstem |
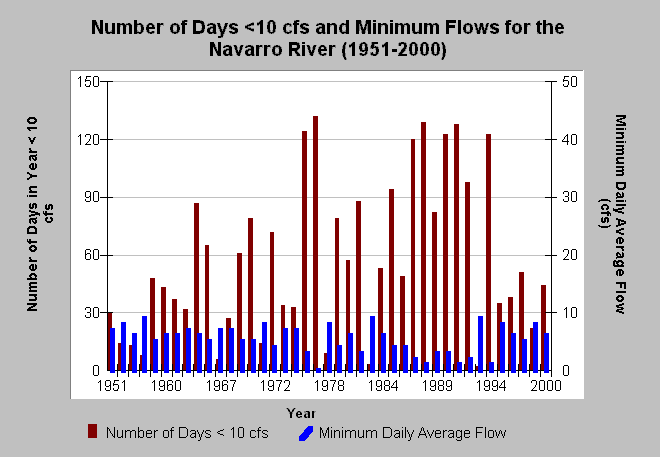
| Topic | Flow: Navarro River - Frequency of Flows <10 cfs, 1951-2000 |
| Caption: This chart shows the number of days in a year with flow less than 10 cubic feet per second and minimum average daily flow by calendar year for the Navarro River. The latter is plotted on the right y-axis. Low flow days ranged from just two days <10 cfs in 1983 to 132 days in 1977. Minimum daily average flows have dropped to less than 1 cfs in 1988, 1991 and 1994 but the Navarro went dry in 1977. The highest minimum daily flows have been nine cubic feet per second. The data are from USGS stream gauge 11468000. See Info Links for more information. Jackson (1991) noted that flows in the Navarro River were decreasing relative to runoff (see Flow: Navarro River - Runoff vs. Flows, 1951-1988). | |
 |
To learn more about this topic click Info Links .
To view additional information (data source, aquisition date etc.) about this page, click Metadata .
To view the table with the chart's data, click Chart Table web page.
To download the table with the chart's data, click nav_flow_lowest112.db (size 4,096 bytes) .
To view the table with the chart's source data, click Source Table web page.
To download the table with the chart's source data, click nav_flow_wy.dbf (size 2,027,599 bytes)
| www.krisweb.com |
