| Area | S.F. Trinity |
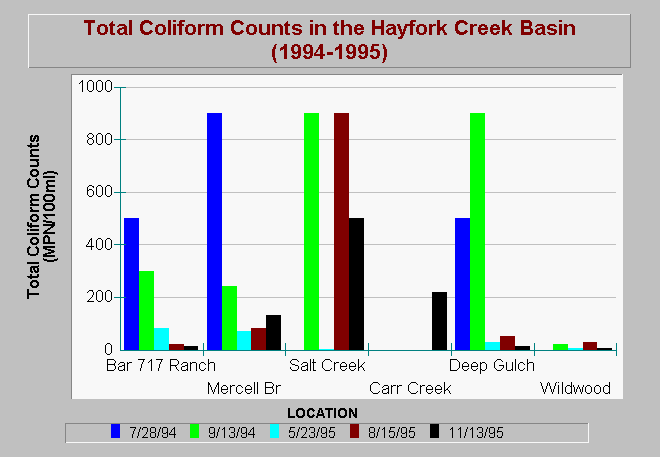
| Topic | Coliform: (Total) Hayfork Creek at Six Sites 1994-1995 |
| Caption: Total coliform count data summarized above was collected in Hayfork Creek and lower Salt Creek during 1994 and 1995. High total coliform counts in 1994 may have been owing in part to low flows because it was a particularly dry year. However, a similar late summer peak was exhibited during late summer 1995 and counts remained relatively high through November 1995 in lower Salt Creek. Data from the Natural Resources Conservation Service, Weaverville, CA. Click on Info Links for more information. | |
 |
To learn more about this topic click Info Links .
To view additional information (data source, aquisition date etc.) about this page, click Metadata .
To view the table with the chart's data, click Chart Table web page.
To download the table with the chart's data, click hytocoli.dbf (size 916 bytes) .
| www.krisweb.com |
