| Area | S.F. Trinity |
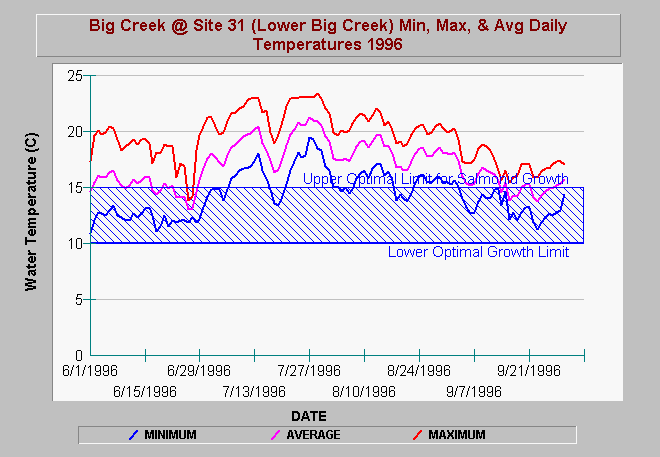
| Topic | Temperature: Min, Max & Avg Big Creek (NRCS Site 31) below Hwy 3 1996 |
| Caption: Minimum, maximum and average daily water temperatures of lower Big Creek above Hayfork Creek for 1996 are displayed above. Water temperatures rose to stressful levels for salmonids with the minimum temperature far exceeding optimal growth limits during July and August. Lower Big Creek temperatures are substantially elevated due to flow depletion. Data provided by NRCS Weaverville. See Picture for a map of gauge locations. | |
 |
To learn more about this topic click Info Links .
To view additional information (data source, aquisition date etc.) about this page, click Metadata .
To view the table with the chart's data, click Chart Table web page.
To download the table with the chart's data, click site3196.dbf (size 8,718 bytes) .
To view the table with the chart's source data, click Source Table web page.
To download the table with the chart's source data, click hf_temps.dbf (size 4,579,055 bytes)
| www.krisweb.com |
