| Area | Shasta |
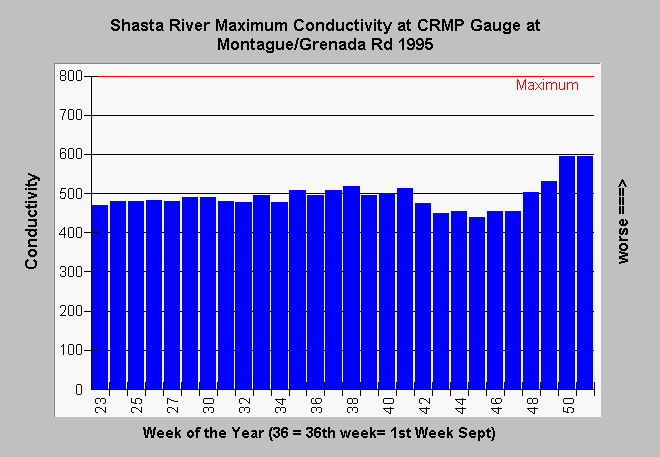
| Topic | Conductivity: Maximum at CRMP Gauge 1995 |
| Caption: The Chart above shows the maximum weekly conductivity of the Shasta River at the Montague- Grenada Road as measured at the CRMP's continuous recording stream monitoring gauge in 1995. The period of record spans from the third week in May (23rd week of the year) to the last week in December. The NCRWQCB Basin Plan objective for specific conductance in the Shasta River is a maximum not exceeding 800 micro-mhos, and a median not exceeding 600 micro-mhos. The median represents the monthly mean for a calendar year. In 1995, 600 micro-mhos were never exceeded. Elevated conductivity levels can result from any increase in dissolved solids. Mineralized spring water, natural soil constituents, fertilizer and animal waste can all contribute to increased conductivity. Click on the Info Links tab for more information. | |
 |
To learn more about this topic click Info Links .
To view additional information (data source, aquisition date etc.) about this page, click Metadata .
To view the table with the chart's data, click Chart Table web page.
To download the table with the chart's data, click shcon95.dbf (size 1,960 bytes) .
To view the table with the chart's source data, click Source Table web page.
To download the table with the chart's source data, click shmoncon.dbf (size 4,827 bytes)
| www.krisweb.com |
