| Area | Shasta |
| Topic | Conductivity: Avg & Max at Seven Shasta Locations 1988-92 |
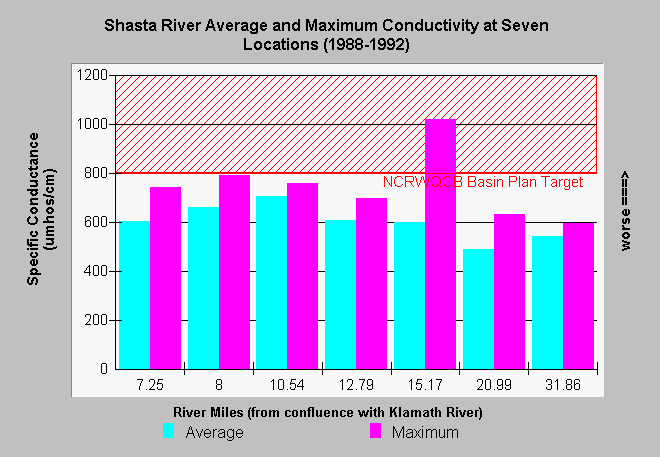
| Caption: Staff for the North Coast Regional Water Quality Control Board collected conductivity data from 1988 to 1992 at seven stations along the Shasta River (see below for locations). The values above are the absolute maximum conductivity and average conductivity for all measurements taken from 1986 to 1992 (see Chart Table). Conductivity in the Shasta River can exceed both the North Coast Regional Water Quality Control Board median (600 micro mohs) and maximum (800 micro mohs) objectives. Elevated conductivity levels result from any increase in dissolved solids. Mineralized spring water, natural soil constituents, fertilizer and animal waste can all contribute to increased conductive. Shasta River conductivity was not sampled using a continuous data recorder and peaks may occur over a short period of time; therefore, data should not be construed to represent a complete picture of this parameter. Conductivity readings are consistently higher during drought years according to reports by the California Department of Water Resources. Click on the Info Links tab at the top of this page for a more in-depth description of sampling methods and results. The River Miles above represent bridge crossings at the following locations: Highway 263 = rm 7.25, Anderson Grade Rd. = rm 8, Ager/Beswick Rd. = rm 10.54, Highway 3 = rm 12.79, Montague/Grenada Rd = rm 15.17, A-12 = rm 20.99, East Louie Rd. = rm 31.86, Riverside Dr. = rm 37.73. | |
 |
To learn more about this topic click Info Links .
To view additional information (data source, aquisition date etc.) about this page, click Metadata .
To view the table with the chart's data, click Chart Table web page.
To download the table with the chart's data, click gwdocon2.dbf (size 557 bytes) .
To view the table with the chart's source data, click Source Table web page.
To download the table with the chart's source data, click gwdocond.dbf (size 37,422 bytes)
| www.krisweb.com |
