| Area | Shasta |
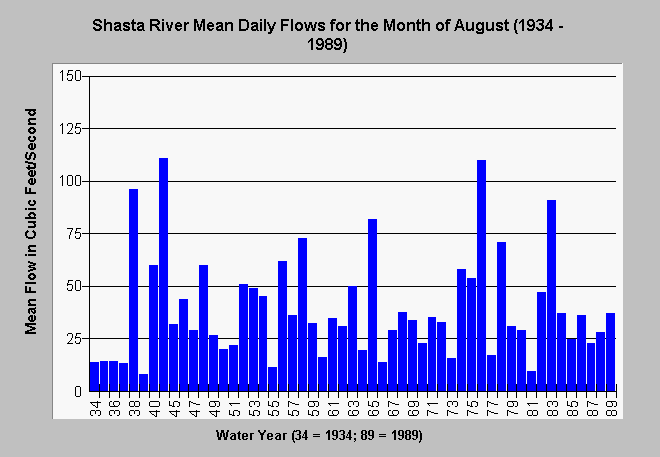
| Topic | Flow: Shasta River August Mean Daily (1934-89) |
| Caption: Mean Shasta River daily flows for the month of August from 1934 to 1989 displayed above are summarized from U.S. Geologic Survey records. There appears to be no long term trend in diminishing flows over time during this period of record but there are some years where average daily flow drops below 25 cfs. Low flows may contribute to water quality problems such as high water temperature. | |
 |
To learn more about this topic click Info Links .
To view additional information (data source, aquisition date etc.) about this page, click Metadata .
To view the table with the chart's data, click Chart Table web page.
To download the table with the chart's data, click augyka.dbf (size 1,340 bytes) .
To view the table with the chart's source data, click Source Table web page.
To download the table with the chart's source data, click 3090.dbf (size 233,632 bytes)
| www.krisweb.com |
