| Area | Middle Trinity |
| Topic | Flow: Browns Creek Exceedance Curve |
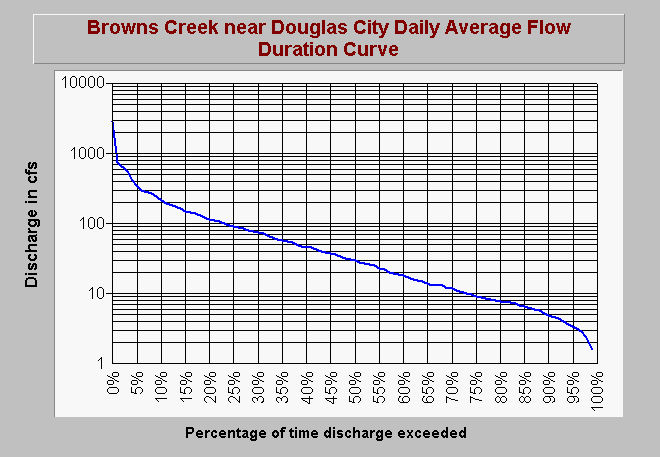
| Caption: This flow exceedance curve for Browns Creek is based on ten years of U.S. Geologic Survey flow data. The graph shows the percentage of time that certain flows can be expected. The maximum flow during this period was 2860 cfs but flows of greater than 342 cfs are exceeded only 5% of the time. Flows are less than 10 cfs 30% of the time. This chart is patterned after treatments created by Mc Bain and Trush to support the Trinity River flow evaluation project (see Info Links). | |
 |
To learn more about this topic click Info Links .
To view additional information (data source, aquisition date etc.) about this page, click Metadata .
To view the table with the chart's data, click Chart Table web page.
To download the table with the chart's data, click fdcbrwns.dbf (size 1,312 bytes) .
| www.krisweb.com |
