| Area | Mainstem Trinity |
| Topic | Flow: Trinity at Lewiston 1912-2002 |
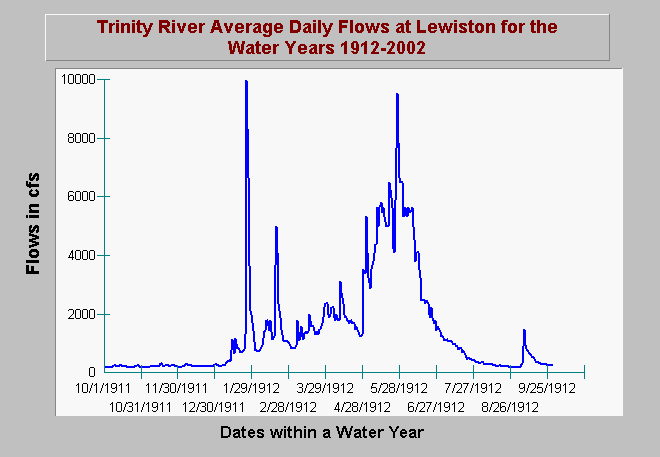
| Caption: This chart displays the hydrograph by water year for the main stem of the Trinity at Lewiston as taken from USGS stream gauge flow measurements. The water year first shown above is for 1912 but the Chart Table has all subsequent water years up to 2002. There are two prominent flood peaks of near 10,000 cfs in January and May of 1912. This would be typical of pre-dam winter storm and spring snow melt seasonal flood peaks. The convention for water years is to begin them on October 1 of the previous calendar year so the 1912 water year began on October 1, 1911. You may call up any water year by clicking on Chart Table, selecting the find a record tool (magnifying glass symbol), and choosing the beginning date of a water year (ie.10/1/50). Return to the Chart and hit the green recycle button on the top, right hand corner of the screen. The X axis of the graph may vary depending on the magnitude of the flows in any given year. | |
 |
To learn more about this topic click Info Links .
To view additional information (data source, aquisition date etc.) about this page, click Metadata .
To view the table with the chart's data, click Chart Table web page.
To download the table with the chart's data, click lewflow1912_2002.dbf (size 631,652 bytes) .
| www.krisweb.com |
