| Area | Lower Big River |
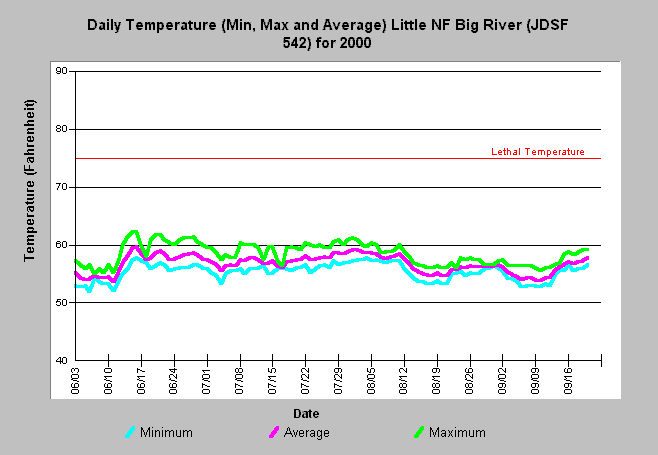
| Topic | Temperature: Min, Max and Average (F), LNF Big River Site 542, 2000 |
| Caption: Daily minimum, maximum and average water temperature at site 542 in an upper portion of the Little North Fork Big River sub-basin did not exceeded the lethal threshold of 75 degrees F in during the summer of 2000. In fact, temperatures fell largely within optimal temperatures for salmonids and would be suitable for rearing of coho salmon juveniles. The 75 degree F (23.9 C) daily maximum for coho salmon was chosen as a threshold for the North Coast Watershed Assessment Program based on literature review. This value, however, is based on laboratory tests and much lower temperatures will cause loss of coho in the wild (see Temperature Background page). See Info Links for more information. Data provided by the Jackson State Demonstration Forest. Click on Picture for map of locations. | |
 |
To learn more about this topic click here .
To view the table with the chart's data, click Chart Table web page.
To download the table with the chart's data, click jsf_mma.db (size 190,464 bytes) .
To see meta information about the data table used for this topic click here
To view the table with the chart's source data, click Source Table web page.
To download the table with the chart's source data, click jsf_temp.dbf (size 4,186,234 bytes)
| www.krisweb.com |
