| Area | Caspar Creek |
| Topic | Climate: Caspar Creek Flow Data, 1963-1999 |
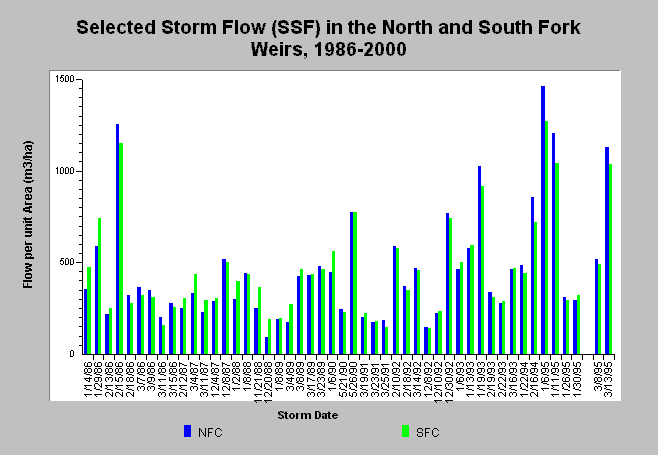
| Caption: Selected Storm Flow over the North and South Fork Weirs in cubic meters per hectare from the period 1986-1999. Data collected by Redwood Sciences Lab. | |
 |
To learn more about this topic click here .
To view the table with the chart's data, click Chart Table web page.
To download the table with the chart's data, click rsl_ssf.dbf (size 19,135 bytes) .
To see meta information about the data table used for this topic click here
| www.krisweb.com |
