| Area | South Fork Battle |
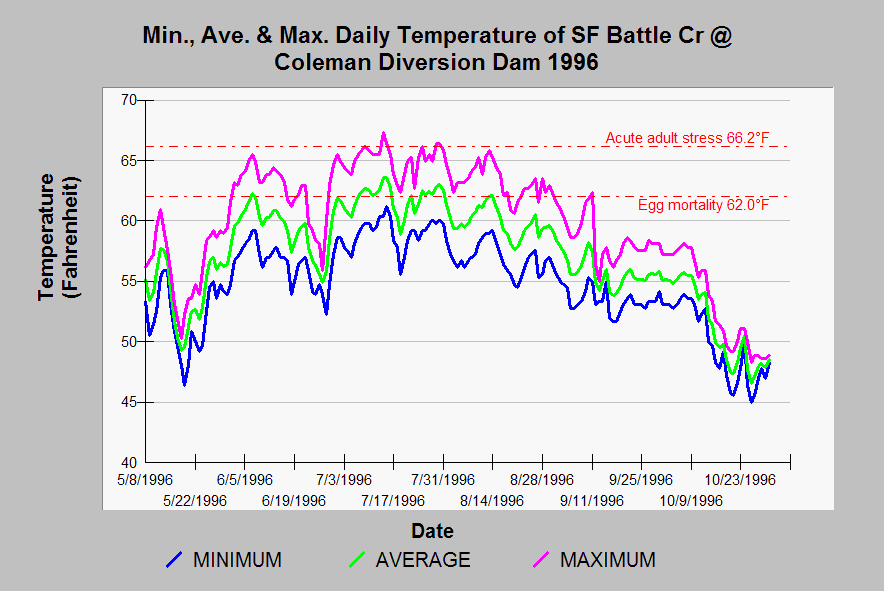
| Topic | Temperature: Min, Ave, Max at Coleman Div Dam, 1996 |
| Caption: This temperature graph shows minimum, maximum, and average water temperatures on South Fork Battle Creek in 1996. The probe was placed below the influence of the tailwater from the Inskip Powerhouse as evidenced by the similar temperature to the Inskip Canal (see next Chart). Thresholds shown on the graph above are for the egg life history stage before July 1 for winter chinook, spring chinook eggs after September 15 and for holding spring chinook adults during summer (July-September). Temperatures in 1996 would have been partially lethal for incubating eggs of winter-run chinook salmon (before July 1) and stressful for pre-spawning spring-run chinook salmon (July 1- Sept. 15). See Info Links for more information on temperature thresholds. | |
 |
To learn more about this topic click Info Links .
To view additional information (data source, aquisition date etc.) about this page, click Metadata .
To view the table with the chart's data, click Chart Table web page.
To download the table with the chart's data, click sf2mma96.dbf (size 12,375 bytes)
To download the table with the chart's data as an Excel spreadsheet, click sf2mma96.dbf.xls (size 15,920 bytes) .
| www.krisweb.com |
