| Area | South Fork Battle |
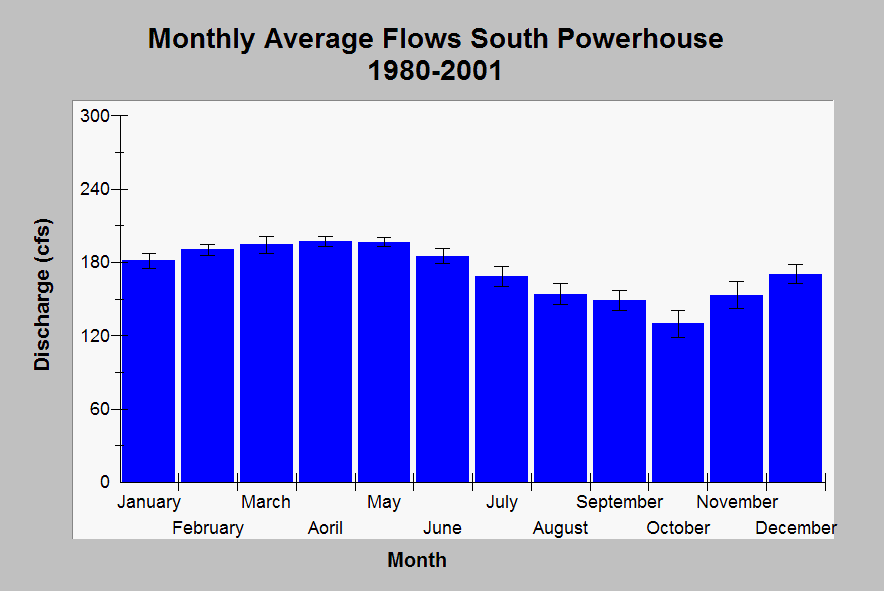
| Topic | Flow: South Powerhouse - Monthly Ave, 1980-2001 |
| Caption: This chart shows monthly average flow in South Powerhouse (USGS gage 11376410) for the period of 1980 to 2001. Whiskers show one standard error. See Info Links for further information. | |
 |
To learn more about this topic click Info Links .
To view additional information (data source, aquisition date etc.) about this page, click Metadata .
To view the table with the chart's data, click Chart Table web page.
To download the table with the chart's data, click flow_battle_monthly_cross.db (size 8,192 bytes)
To download the table with the chart's data as an Excel spreadsheet, click flow_battle_monthly_cross.db.xls (size 13,211 bytes) .
| www.krisweb.com |
