| Area | North Fork Battle |
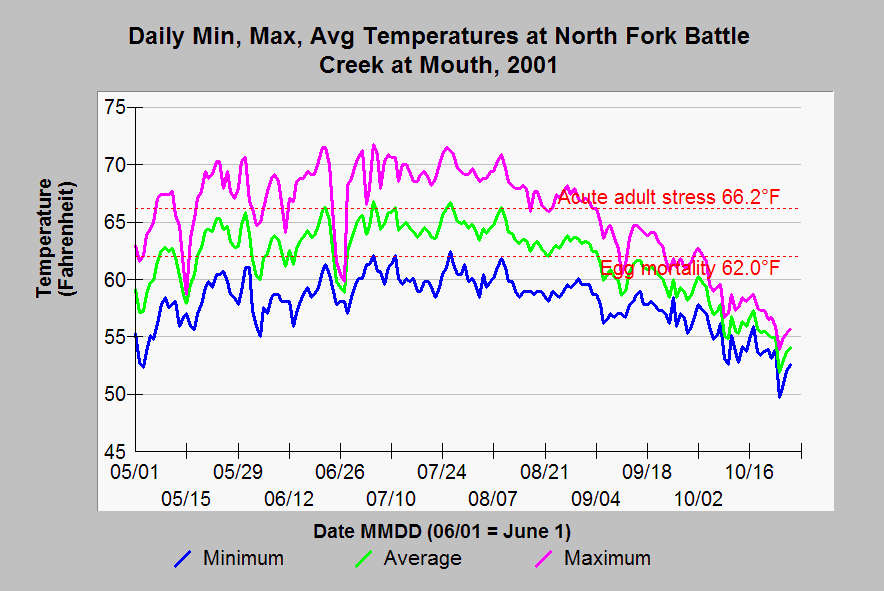
| Topic | Temperature: Min, Max, Avg at North Fork Battle near Mouth, 2001 |
| Caption: This Chart shows daily minimum, average, and maximum water temperatures at North Fork Battle near its mouth for the year 2001. During the period June 15-30, average temperature exceeded 62°F, indicating that winter-run chinook eggs would experience 100% mortality. During the period July 1 to September 14, average temperature exceeded 66.2°F, indicating that spring-run chinook adults holding at the site would be unable to successfully spawn. During the period September 15-30, average temperature did not exceed 62°F, indicating that the site was suitable for spring-run chinook eggs. Reference values were taken from Armour (1991), Berman (1990; as cited in USFWS 1996b), USBR (1991), and CDFG (1998b). See Info Links for more information. | |
 |
To learn more about this topic click Info Links .
To view additional information (data source, aquisition date etc.) about this page, click Metadata .
To view the table with the chart's data, click Chart Table web page.
To download the table with the chart's data, click temp_bat_dwr_nf_98_01_daily.db (size 167,936 bytes)
To download the table with the chart's data as an Excel spreadsheet, click temp_bat_dwr_nf_98_01_daily.db.xls (size 139,488 bytes) .
| www.krisweb.com |
