| Area | North Fork Battle |
| Topic | Climate: Air temperature - Volta Power House - Ave Monthly 1948-1974 |
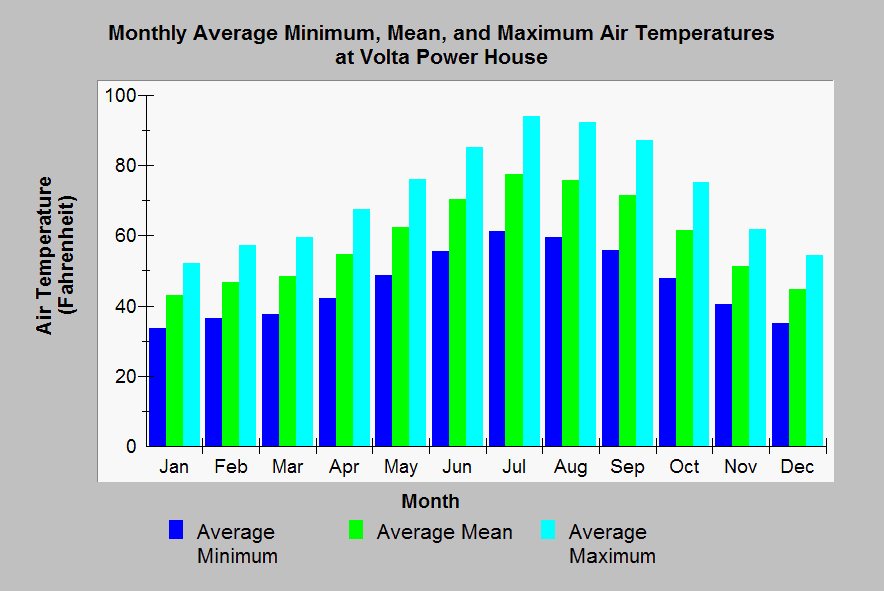
| Caption: This chart shows monthly average minimum, mean, and maximum temperatures at Volta Power House based on records extending from 1948 to 1974. Average monthly air temperatures generally stay above freezing year-round, which is expected since the elevation is only 2200 feet. Maximum air temperatures occur during July, while, minimums occur during January. Air temperatures are calculated from data from the National Climatic Data Center that is provided via the Western Regional Climate Data Center. | |
 |
To learn more about this topic click Info Links .
To view additional information (data source, aquisition date etc.) about this page, click Metadata .
To view the table with the chart's data, click Chart Table web page.
To download the table with the chart's data, click climate_airtemp_monthlyave_volta_ph.dbf (size 702 bytes)
To download the table with the chart's data as an Excel spreadsheet, click climate_airtemp_monthlyave_volta_ph.dbf.xls (size 4,096 bytes) .
| www.krisweb.com |
