| Area | Basin-wide |
| Topic | Habitat: Pool Frequency (Scour) for All Battle WA Sites 2001-2002 |
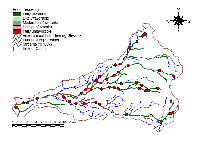
The Battle Creek WA shows a map of scour pool frequency at all sites measured in 2001 and 2002 with EMDS criteria displayed as color codes with green indicating "fully favorable" salmonid habitat and red "fully unfavorable" conditions. The only reaches with fully favorable pool frequency for salmonids are four within lower Battle Creek and one on the South Fork above Panther Creek. Partially favorable habitats are shown in gray and pink. Taken from Figure 11 in the Battle Creek WA.
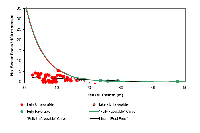
This chart from the Battle Creek WA shows the distribution of scour pools versus the expected log-normal relationship with channel width, which is how the EMDS pool frequency rating curve is calculated. The green dots indicate sites where scour pool frequency is "fully favorable" for salmonids, red dots show sites where pool frequency was "fully unfavorable", and light red is "likely unfavorable". Taken from Figure 10 in the Battle Creek WA.
 Click on image to enlarge (31K).
 Click on image to enlarge (13K).
To learn more about this topic click Info Links
To view additional information (data source, aquisition date etc.) about this page, click Metadata
| www.krisweb.com |
