| Area | Basin-wide |
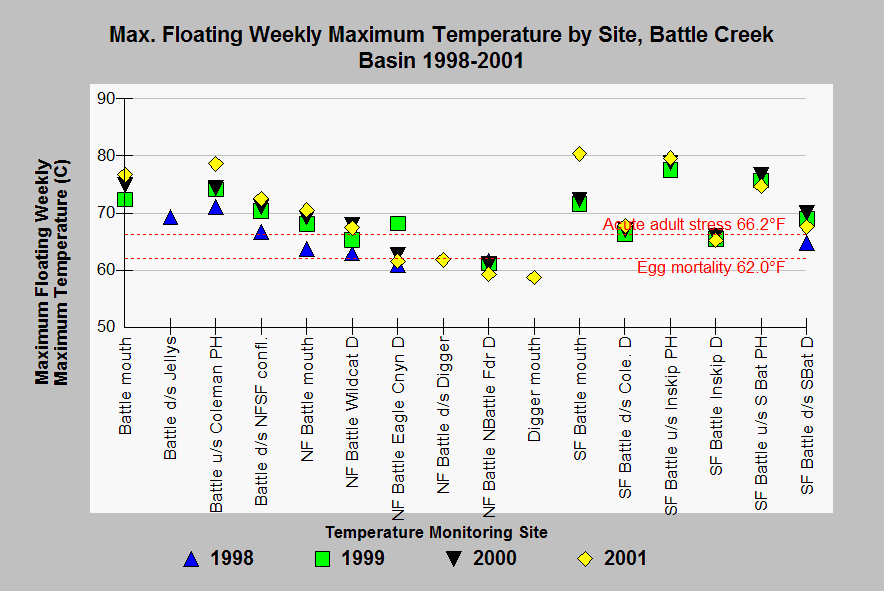
| Topic | Temperature: MWMT at Battle Sites, by Year 1998-2001 |
| Caption: This chart shows maximum floating weekly maximum temperature (MWAT) for each site Battle Creek basin with available data in the years 1998-2001. Sites are grouped by stream and are listed in upstream order. Reference values shown in the chart were taken from Armour (1991), Berman (1990; as cited in USFWS 1996), USBR (1991), and CDFG (1998). Data were provided by the California Department of Water Resources. See Info Links for more information. | |
 |
To learn more about this topic click Info Links .
To view additional information (data source, aquisition date etc.) about this page, click Metadata .
To view the table with the chart's data, click Chart Table web page.
To download the table with the chart's data, click temp_battle_dwr_98_01_mwat_mwmt_streamonly.dbf (size 11,122 bytes)
To download the table with the chart's data as an Excel spreadsheet, click temp_battle_dwr_98_01_mwat_mwmt_streamonly.dbf.xls (size 12,760 bytes) .
| www.krisweb.com |
