| Area | Basin-wide |
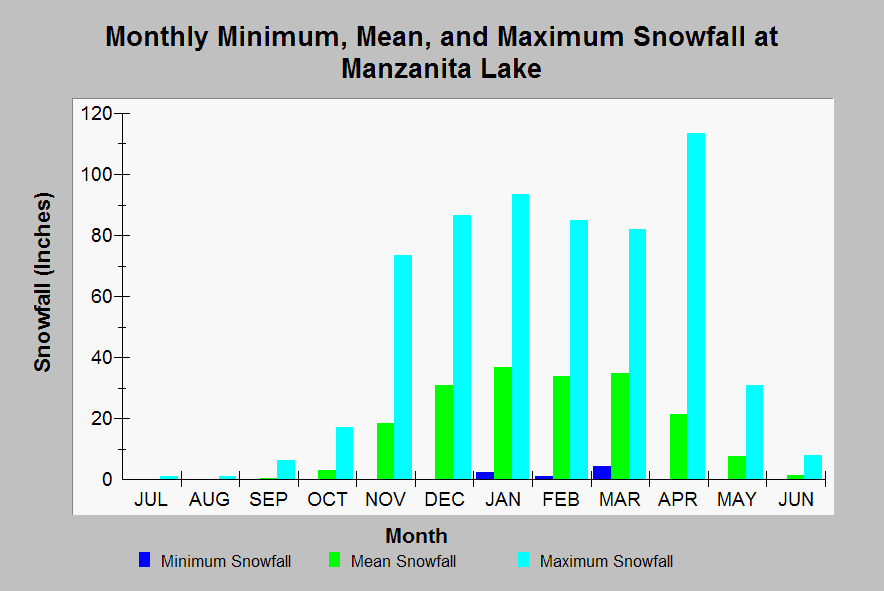
| Topic | Climate: Snowfall - Manzanita Lake - Average Monthly 1949-2000 |
| Caption: This chart shows monthly minimum, mean, and maximum snowfall accumulation (inches), at Manzanita Lake from all gauge records from 1949-2000. The snow pack diminishes considerably between April and May with the shift in seasons. Data from the Western Regional Climate Center. See Info Links for more information. | |
 |
To learn more about this topic click Info Links .
To view additional information (data source, aquisition date etc.) about this page, click Metadata .
To view the table with the chart's data, click Chart Table web page.
To download the table with the chart's data, click climate_snowfall_monthlyave_manzanita_lake.dbf (size 786 bytes)
To download the table with the chart's data as an Excel spreadsheet, click climate_snowfall_monthlyave_manzanita_lake.dbf.xls (size 4,096 bytes) .
| www.krisweb.com |
