| Area | Salmon Creek |
| Topic | WQ: Specific Conductance in Salmon Creek 2001 |
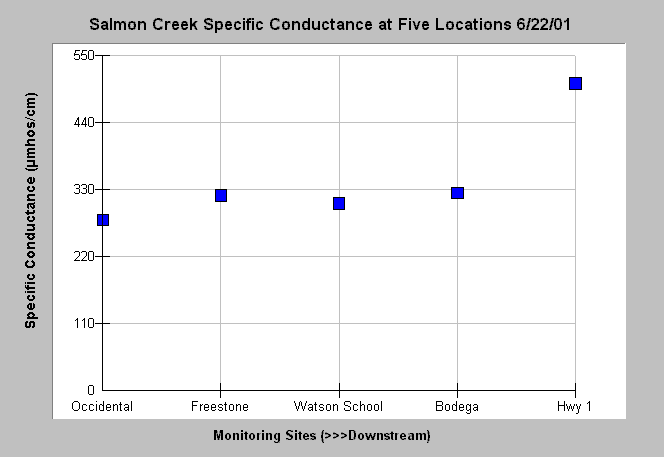
| Caption: This graph shows one-time sampling measurements of specific conductance at five stations (going downstream from left to right) in Salmon Creek from 2001. Conductivity increases downstream as does pH (see previous Topic). This could be as a result of nutrient inputs from cattle waste or other non-point source pollution. These data were collected by the North Coast Regional Water Quality Control Board as a part of the Surface Water Ambient Monitoring Program (SWAMP). See Info Links for more information. | |
 |
To learn more about this topic click Info Links .
To view additional information (data source, aquisition date etc.) about this page, click Metadata .
To view the table with the chart's data, click Chart Table web page.
To download the table with the chart's data, click wq_salmon_ncrwqcb_2001.dbf (size 1,179 bytes) .
To view the table with the chart's source data, click Source Table web page.
To download the table with the chart's source data, click wq_russianandsalmon_ncrwqcb_2001.dbf (size 4,018 bytes)
| www.krisweb.com |
