| Area | S Marin/Redwood Creek |
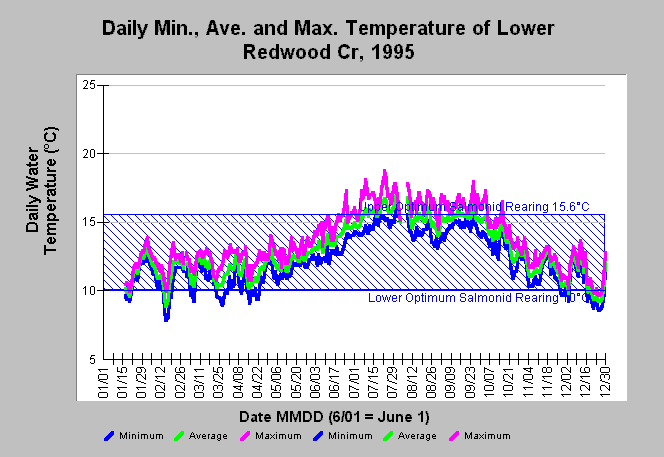
| Topic | Temperature: Redwood Creek at Lower Min, Max, and Average 1995 |
| Caption: The chart shows the daily minimum, maximum, and average water temperature in Celsius (°C) at lower Redwood Creek (above Big Lagoon) for the year 1995. Note that there are two sets of statistics in the legend because there was an interruption in the continuous monitoring at that site. Daily maximum and average temperatures were above 15.6°C, the upper optimal temperature for salmonid rearing, during July, August and September. The reference value of 10-15.6°C optimum temperature range for juvenile salmonid rearing is based on McCullough (1999). Two automated sensor probes records were merged to form the above Chart, which explains why there are two series of legends. Data were collected by the Golden Gate National Recreation Area. See Info Links for more information. Click Map to see a map of temperature monitoring locations | |
 |
To learn more about this topic click Info Links .
To view additional information (data source, aquisition date etc.) about this page, click Metadata .
To view the table with the chart's data, click Chart Table web page.
To download the table with the chart's data, click temp_goga_95_01_daily.db (size 133,120 bytes) .
To view the table with the chart's source data, click Source Table web page.
To download the table with the chart's source data, click tempraw_goga_95_01.dbf (size 2,368,801 bytes)
| www.krisweb.com |
