| Area | S Marin/Redwood Creek |
| Topic | Fish: Redwood Creek Juvenile Salmonid Abundance (Fish/100ft) 1994 Jul |
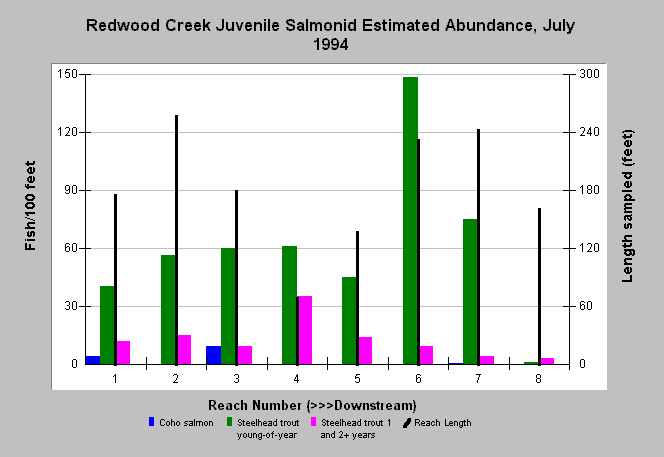
| Caption: The graph shows the average estimated number of juvenile salmonids per 100 feet for Redwood Creek in July 1994. The length of the surveys is on the axis at right and sites on the X-axis are in downstream order to the right. Note that values for Site 8 are actual capture totals, not densities. There was a significant decrease in coho salmon densities compared to 1992 and 1993. Juvenile salmonids were sampled again in October (see next Topic) to determine late summer and fall fish survival due to concern over drought conditions in 1993-1994 and groundwater pumping (Smith, 1994b). Data were collected by Dr. Jerry J. Smith of San Jose State University for the Golden Gate National Recreation Area. See Picture for a map of the sampling sites and Info Links for more information. | |
 |
To learn more about this topic click Info Links .
To view additional information (data source, aquisition date etc.) about this page, click Metadata .
To view the table with the chart's data, click Chart Table web page.
To download the table with the chart's data, click fish_redwood_smithsum_jul1994.db (size 4,096 bytes) .
To view the table with the chart's source data, click Source Table web page.
To download the table with the chart's source data, click fish_redwood_smithsum_1992_2001.xls.db (size 16,384 bytes)
| www.krisweb.com |
