| Area | Stemple Creek |
| Topic | WQ: PH in Stemple Creek/Estero de San Antonio 1992-1993 |
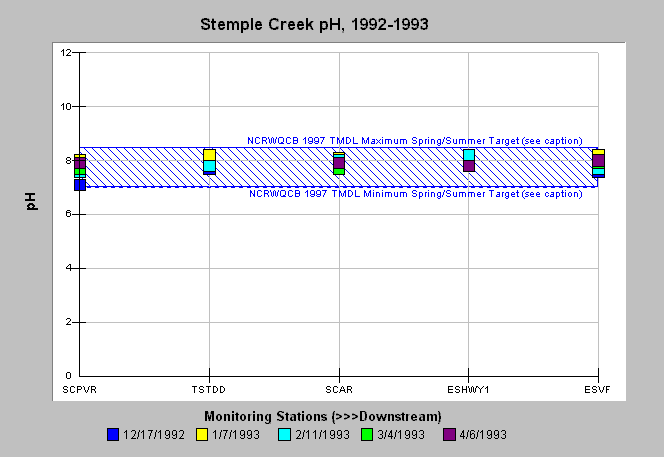
| Caption: PH was measured at twelve locations, with varying frequencies, in the Stemple Creek watershed by the North Coast Regional Water Quality Control Board (NCRWQCB) from 1990-1994. The graph shows data collected at five locations (going downstream from left to right) from 1992-1993. The reference value represents the North Coast Regional Water Quality Control Board (NCRWQCB) Stemple Creek TMDL threshold pH range (7-8.5) to be met by 2004 during late spring and early summer (Salisbury, 1997). See Picture for monitoring locations and Info Links for more information. | |
 |
To learn more about this topic click Info Links .
To view additional information (data source, aquisition date etc.) about this page, click Metadata .
To view the table with the chart's data, click Chart Table web page.
To download the table with the chart's data, click wq_stemple_ncrwqcb_ph_1992_1993.db (size 4,096 bytes) .
To view the table with the chart's source data, click Source Table web page.
To download the table with the chart's source data, click wq_stemple_ncrwqcb_1990_1994.dbf (size 10,150 bytes)
| www.krisweb.com |
