
| Area | Lagunitas Creek |
| Topic | WQ: Turbidity in Lower Lagunitas Creek Watershed 1995-2002 |
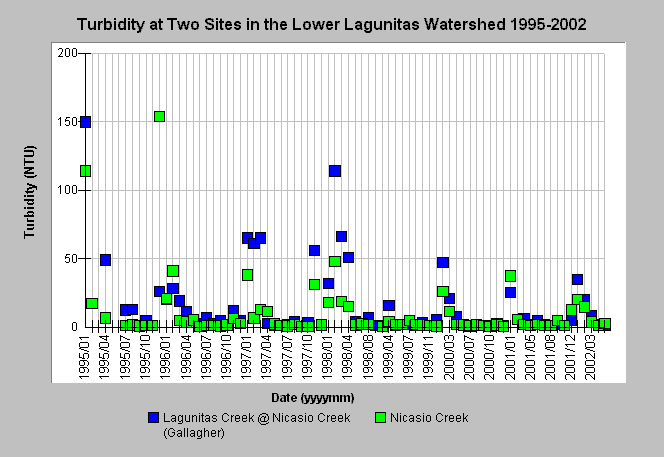
| Caption: This graph shows turbidity measured approximately monthly in Nicasio Creek and Lagunitas Creek at Gallagher from 1995-2002. All values represent one-time sampling per month, except for a few values which represent the average of two samples taken that month (See Source Table). Data were collected by Marin Municipal Water District. See Info Links for more information. | |
 |
To learn more about this topic click Info Links .
To view additional information (data source, aquisition date etc.) about this page, click Metadata .
To view the table with the chart's data, click Chart Table web page.
To download the table with the chart's data, click wq_mmwd_turb_1995_2002.xls.db (size 6,144 bytes) .
To view the table with the chart's source data, click Source Table web page.
To download the table with the chart's source data, click wq_mmwd_all_1995_2002.xls.db (size 49,152 bytes)
| www.krisweb.com |