| Area | Lagunitas Creek |
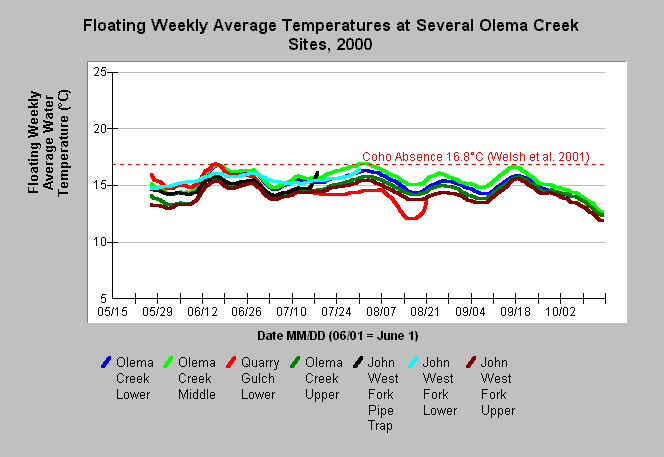
| Topic | Temperature: Olema Creek Floating Weekly Ave @ Several Sites 2000 |
| Caption: This chart shows the floating weekly average temperature at seven sites of the Olema Creek sub-basin from May 15 to October 15, 2000. Most sites were optimal for coho rearing. However, maximum floating weekly average water temperature exceeded 16.8°C, but for only brief periods at upper Quarry Gulch, middle Olema Creek and lower Olema Creek. Welsh et al. (2001) found that coho are not likely to persist where maximum floating weekly average temperature (MWAT) exceeds 16.8°C. Data were collected by the Point Reyes National Seashore. See Info Links for more information. | |
 |
To learn more about this topic click Info Links .
To view additional information (data source, aquisition date etc.) about this page, click Metadata .
To view the table with the chart's data, click Chart Table web page.
To download the table with the chart's data, click temp_pore1999_2000_daily.db (size 139,264 bytes) .
To view the table with the chart's source data, click Source Table web page.
To download the table with the chart's source data, click temp_pore1999_2000_rawtrim.dbf (size 1,413,823 bytes)
| www.krisweb.com |
