| Area | Lagunitas Creek |
| Topic | Temperature: All MMWD Sites, MWAT by Year 1997-2002 |
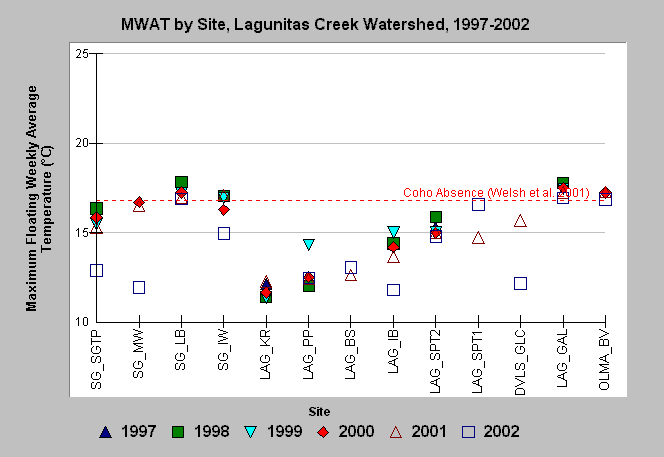
| Caption: The chart shows maximum floating weekly average temperature (MWAT) for each site monitored by the Marin Municipal Water District in the Lagunitas Creek watershed during 1997-2002. Sites are listed in downstream order with furthest upstream sites on the left, and include sites in San Geronimo Creek, Devils Gulch, Olema Creek, and mainstem Lagunitas Creek. The coho stress value of 16.8 °C comes from Welsh et al. (2001). See Map for monitoring locations and Info Links for more information. | |
 |
To learn more about this topic click Info Links .
To view additional information (data source, aquisition date etc.) about this page, click Metadata .
To view the table with the chart's data, click Chart Table web page.
To download the table with the chart's data, click temp_mmwd_mwat_1997_2002.db (size 6,144 bytes) .
To view the table with the chart's source data, click Source Table web page.
To download the table with the chart's source data, click tempraw_mmwd_97_02.dbf (size 13,604,076 bytes)
| www.krisweb.com |
