| Area | Lagunitas Creek |
| Topic | Aquatic Invertebrates: Lagunitas Creek EPT Taxa 2001 |
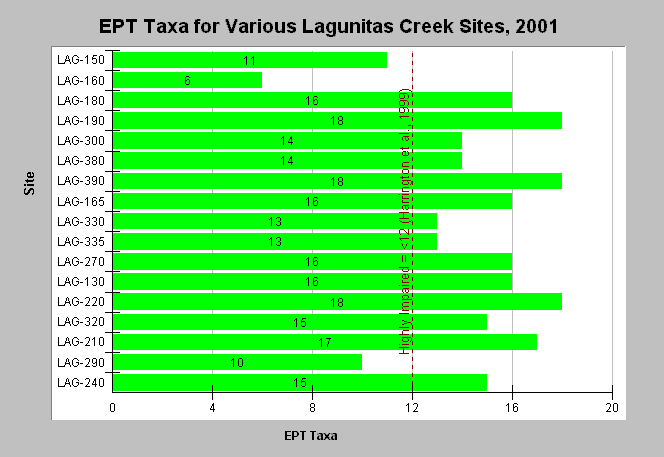
| Caption: This graph shows average EPT Taxa for sites in the Lagunitas Creek watershed sampled in spring 2001. The reference value shown in the graph provides a regional comparison to preliminary scoring criteria developed by the California Department of Fish and Game for the Russian River Index of Biological Integrity using California Stream Bioassessment Procedure (CSBP) for first to third order streams (Harrington et al., 1999). This study found that EPT Taxa less than 12 reflected highly impaired conditions. Data were collected by the San Francisco Bay Regional Water Quality Control Board according to CSBP protocols. See Map for the location of sampling sites and Info Links for more information. | |
 |
To learn more about this topic click Info Links .
To view additional information (data source, aquisition date etc.) about this page, click Metadata .
To view the table with the chart's data, click Chart Table web page.
To download the table with the chart's data, click invert_cdfg_lag_2001.db (size 8,192 bytes) .
To view the table with the chart's source data, click Source Table web page.
To download the table with the chart's source data, click invert_cdfg_lagwalker_2001.xls.db (size 12,288 bytes)
| www.krisweb.com |
