| Area | Sonoma Creek |
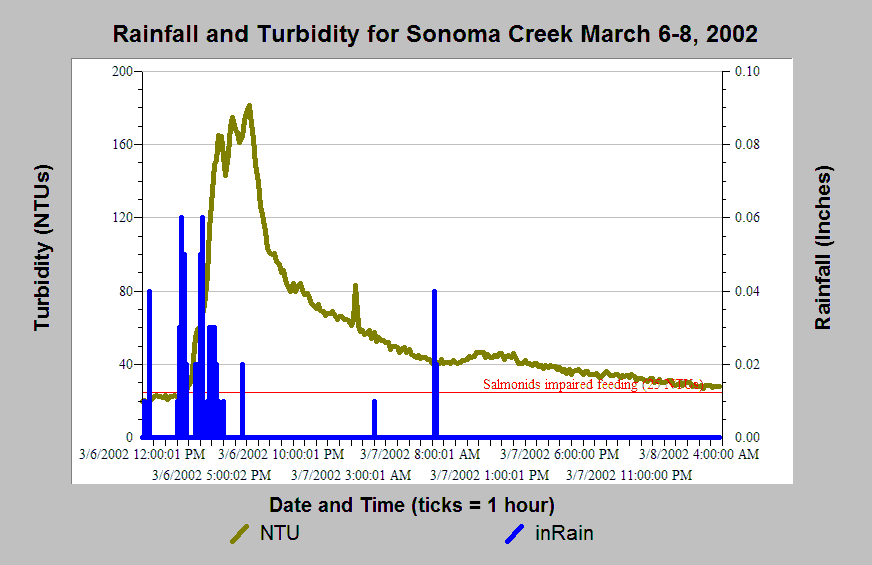
| Topic | Sediment: Turbidity and Rainfall at Eldridge Sonoma Creek 3/6/2002 |
| Caption: This chart shows suspended sediment concentrations from a continuous monitoring in Sonoma Creek on March 6-8, 2002. Turbidity readings greater than 25 NTU have shown impaired feeding for salmonids (Siegler et al. 1984). Data provided by Sonoma Ecology Center. See Info Links for more information. | |
 |
To learn more about this topic click Info Links .
To view additional information (data source, aquisition date etc.) about this page, click Metadata .
To view the table with the chart's data, click Chart Table web page.
To download the table with the chart's data, click station_a_mar6_02.xls.db (size 22,528 bytes)
To download the table with the chart's data as an Excel spreadsheet, click station_a_mar6_02.xls.db.xls (size 43,881 bytes) .
| www.krisweb.com |
