| Area | Sonoma Creek |
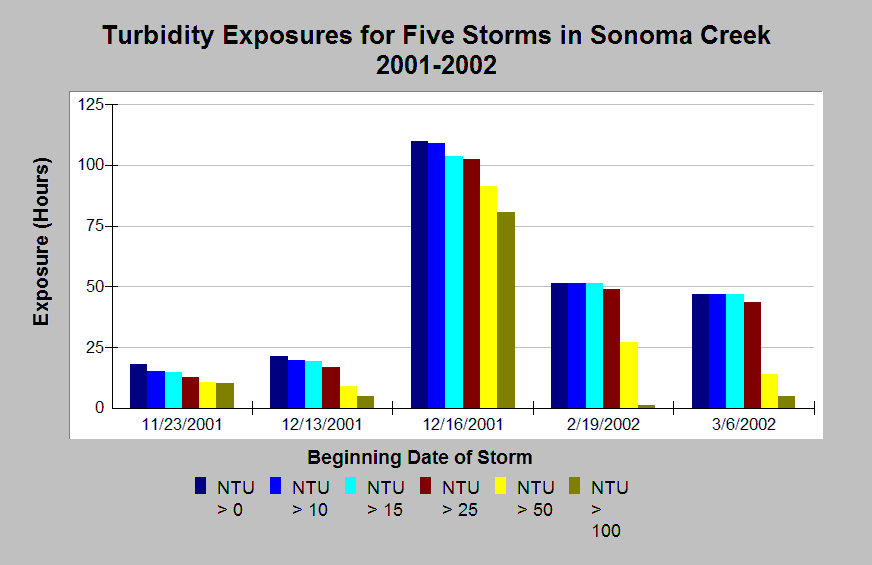
| Topic | Sediment: Turbidity Exposure for 5 Storms in Sonoma Creek 2001-2002 |
| Caption: The Chart displays turbidity exposures for five storm events readings at the Eldridge Station on Sonoma Creek in 2001 and 2002. Turbidity readings >25 NTUs (maroon, yellow and brown bars) have been shown to impair salmonid feeding (Siegler et al. 1984). Data provided by the Sonoma Ecology Center. Click Info Links for more information. | |
 |
To learn more about this topic click Info Links .
To view additional information (data source, aquisition date etc.) about this page, click Metadata .
To view the table with the chart's data, click Chart Table web page.
To download the table with the chart's data, click sec_turbidity01_02.xls.db (size 4,096 bytes)
To download the table with the chart's data as an Excel spreadsheet, click sec_turbidity01_02.xls.db.xls (size 4,608 bytes) .
| www.krisweb.com |
