| Area | Sonoma Creek |
| Topic | Sediment: Storm Intensity and Lag Time in Sonoma Creek 2001-2002 |
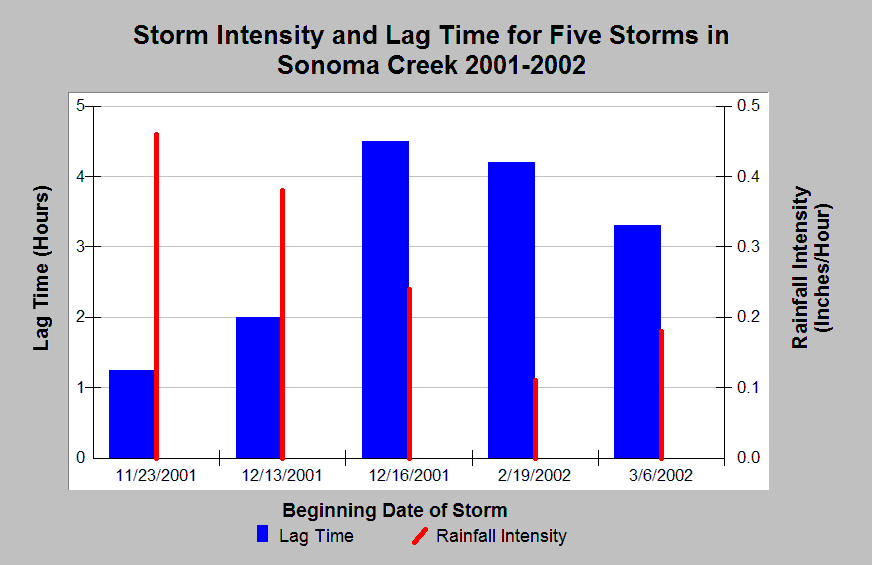
| Caption: The Chart displays the lag time (the hours between peak rainfall and peak turbidity readings) compared with rainfall intensity at the Eldridge Station on Sonoma Creek in 2001 and 2002. This small data set shows an inverse relationship between rainfall intensity (red bars) and lag time (blue bars). Storms with greater intensity are likely to shorten the lag time as stream levels quickly rise. Data provided by the Sonoma Ecology Center. Click Info Links for more information. | |
 |
To learn more about this topic click Info Links .
To view additional information (data source, aquisition date etc.) about this page, click Metadata .
To view the table with the chart's data, click Chart Table web page.
To download the table with the chart's data, click sec_turbidity01_02.xls.db (size 4,096 bytes)
To download the table with the chart's data as an Excel spreadsheet, click sec_turbidity01_02.xls.db.xls (size 4,608 bytes) .
| www.krisweb.com |
